Introduction
Safe drinking water depends on far more than pipes, pumps, and treatment chemicals. Behind every glass of tap water is a structured system of monitoring, verification, and scientific control designed to confirm that treatment is working as intended. Municipal water treatment process testing is the framework utilities use to measure water quality from source to distribution, identify contaminants, verify regulatory compliance, and protect public health.
Municipal water systems face changing conditions every day. Rainfall can increase turbidity in rivers and reservoirs. Seasonal temperature shifts can affect biological activity. Aging infrastructure may contribute metals or create opportunities for microbial regrowth. Industrial runoff, agricultural inputs, and natural minerals can all influence raw water quality. Because these variables change over time, treatment cannot rely on assumptions. It must be supported by routine testing, continuous monitoring, and defensible analytical methods.
This article explains how testing fits into the larger treatment system, what contaminants and indicators are commonly measured, how samples are collected, what laboratory analysis involves, and how utilities interpret data. It also discusses the limits of home screening tools, the importance of quality assurance, and the standards that guide decision-making. Readers seeking broader context may also benefit from resources on the full treatment workflow, related topics in water treatment systems, and ongoing developments in water science.
Understanding testing methods is important not only for utility professionals, but also for homeowners, facility managers, public officials, and anyone interested in drinking water quality. Whether the concern is chlorine residual, lead, nitrates, disinfection byproducts, pathogens, or general aesthetic quality, test data is what allows treatment decisions to be evidence-based rather than reactive.
What It Is
Municipal water treatment process testing is the set of physical, chemical, microbiological, and operational measurements used to assess water quality throughout treatment and distribution. It begins with source water evaluation, continues through each stage of treatment, and extends into storage tanks, mains, and consumer taps. The purpose is to confirm that treatment barriers are effective and that finished water remains safe until it reaches the point of use.
Testing is not a single procedure. It includes several layers:
- Continuous monitoring using online instruments for parameters such as turbidity, pH, disinfectant residual, conductivity, and flow.
- Routine grab sampling collected at scheduled intervals for laboratory analysis.
- Compliance sampling required by regulations for specific contaminants and microbial indicators.
- Investigative sampling triggered by unusual conditions, customer complaints, spills, treatment upsets, or distribution system disturbances.
- Validation testing used when utilities change treatment practices, install new technology, or troubleshoot performance issues.
At a practical level, testing helps answer key questions. Is source water quality changing? Are coagulants removing suspended solids effectively? Is filtration reducing turbidity to acceptable levels? Is disinfection adequate? Are corrosion control measures limiting lead and copper release? Is water chemistry stable across the distribution system? Each question requires specific parameters and suitable methods.
The scope of testing usually includes four broad categories:
- Physical indicators such as turbidity, temperature, color, and suspended solids.
- Chemical indicators such as pH, alkalinity, hardness, chlorine, fluoride, nitrates, metals, and organic compounds.
- Microbiological indicators such as total coliforms, E. coli, heterotrophic plate count, and other organism-specific tests when needed.
- Operational parameters such as contact time, oxidation-reduction potential, particle counts, and filter performance indicators.
For readers looking to place testing within the broader system, a more general overview is available in this complete guide to municipal water treatment. That larger context is helpful because test interpretation depends on understanding treatment goals at each stage.
Main Causes or Sources
The need for testing arises from the many sources of variability and contamination that can affect municipal water. Some originate in the environment, some in treatment infrastructure, and some in the distribution system itself. Identifying causes and sources is essential because testing strategies should be matched to likely risks. A deeper discussion of source-related risks can be found in this overview of causes and sources.
Source Water Variability
Surface water sources such as rivers, lakes, and reservoirs are highly dynamic. Storm events can increase sediment, natural organic matter, microbial loading, and agricultural runoff. Algal blooms may introduce toxins, odors, or taste problems. Snowmelt and drought conditions can alter concentration patterns and water chemistry. Groundwater is generally more stable, but it may contain elevated minerals, arsenic, manganese, iron, fluoride, radionuclides, or nitrates depending on local geology and land use.
Human Activity
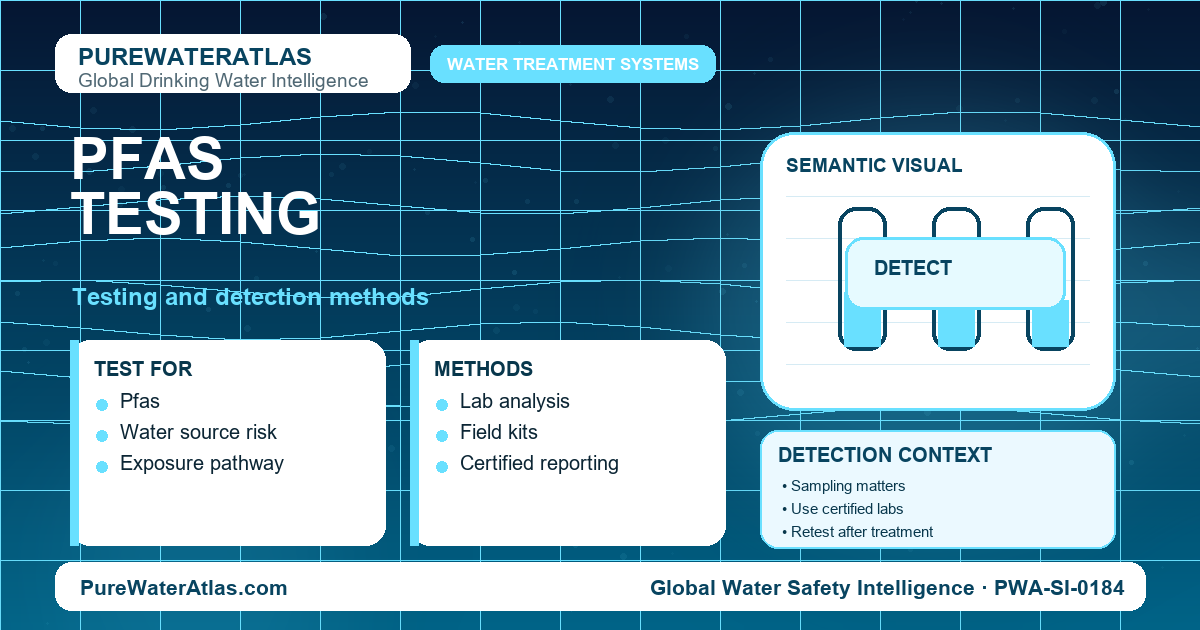
Industrial discharges, wastewater releases, agricultural fertilizers, pesticides, urban stormwater, road salts, and landfill leachate can all introduce contaminants. Some affect raw water directly, while others alter the background chemistry enough to complicate treatment. Emerging contaminants such as PFAS, pharmaceuticals, and personal care product residues may require advanced analytical methods because they are present at low concentrations.
Treatment Process Challenges
Even when source water quality is understood, treatment performance can vary. Coagulation and flocculation depend on pH, alkalinity, temperature, and chemical dose. Filters can experience breakthrough. Disinfection efficiency depends on residual concentration, contact time, temperature, and organic loading. If any process step drifts from target conditions, water quality indicators may change quickly. This is why online monitoring and routine lab verification are both necessary.
Distribution System Effects
Finished water can also change after leaving the plant. Water age, low flow zones, biofilm growth, pressure loss, cross-connections, storage tank turnover, and pipe corrosion may all affect quality. Lead and copper concerns are especially tied to premise plumbing and corrosivity, while disinfectant residual loss can increase microbial vulnerability in distant parts of the network. Utilities therefore test not only at the treatment plant but also at multiple points in the distribution system and, when required, at consumer taps.
Household and Point-of-Use Factors
Consumers often assume municipal quality is determined entirely by the utility, but building plumbing can strongly influence final tap water. Brass fixtures, solder, stagnant water, aging service lines, and treatment devices within the home can alter results. This is one reason municipal water treatment process home testing can sometimes reveal issues that plant data alone does not show, although home kits should be interpreted carefully and confirmed with certified laboratory methods when health-related contaminants are involved.
Health and Safety Implications
Testing is fundamentally a public health activity. Water may look clear and still contain contaminants, or it may have only minor taste changes while meeting all safety criteria. Because health risks differ greatly across contaminants, municipalities must use targeted methods rather than relying on appearance or odor alone. More background on potential outcomes is available in this resource on health effects and risks.
Microbiological Risks
Pathogens are among the most urgent concerns because they can cause acute illness and spread rapidly if treatment barriers fail. Bacteria, viruses, and protozoa may enter source water from sewage contamination, wildlife, or runoff. Utilities often test for indicator organisms such as total coliforms and E. coli rather than every possible pathogen, because indicator testing is more practical and can reveal fecal contamination or distribution system integrity problems. Elevated turbidity, inadequate disinfectant residual, or filtration breakthrough can also increase microbiological risk.
Chemical Risks
Chemical contaminants may create acute or chronic risks depending on the compound and concentration. Nitrates are especially concerning for infants. Arsenic, lead, and some synthetic organic chemicals are associated with long-term health effects. Disinfection byproducts form when disinfectants react with natural organic matter, making it necessary to balance microbial safety with byproduct control. Metals such as manganese and iron may be more aesthetic than toxic at typical levels, but they can still signal treatment or infrastructure issues.
Operational Safety
Not all measurements relate directly to a health-based limit, yet they still matter. pH, alkalinity, conductivity, and chlorine residual influence corrosion control, disinfection stability, and system integrity. Turbidity can interfere with disinfection and may indicate insufficient particle removal. Taste and odor compounds, though often not severe health hazards, can reduce public confidence and lead people to seek alternative water sources that may be less safe.
Vulnerable Populations
Infants, pregnant individuals, older adults, and immunocompromised persons may be more affected by water quality problems. Schools, healthcare facilities, and multi-unit buildings often require extra attention because water age and plumbing configuration can influence contaminant release. For this reason, interpreting municipal water treatment process test results should include consideration of who is exposed, where they are exposed, and whether contamination is system-wide or localized.
Testing and Detection
This is the core of municipal water treatment process testing. Effective detection depends on selecting the right parameter, the right location, the right time, and the right method. No single test can represent total water quality. Utilities therefore build monitoring programs that combine field screening, online sensors, standard laboratory methods, and statistically defensible sample collection plans.
Where Testing Occurs
- Source water intake to characterize incoming quality and detect sudden changes.
- After coagulation and sedimentation to evaluate particle removal efficiency.
- Filter effluent to verify final solids removal and filtration performance.
- Clearwell or post-disinfection locations to confirm disinfectant dosing and contact conditions.
- Distribution system sites to track residual disinfectant, microbiological indicators, and changes in chemistry over distance and time.
- Consumer taps for compliance monitoring, corrosion studies, complaint investigations, or targeted risk assessments.
Key Parameters Commonly Measured
Municipal systems commonly monitor:
- Turbidity
- pH
- Temperature
- Free and total chlorine or chloramine residual
- Alkalinity and hardness
- Conductivity and total dissolved solids
- Nitrate and nitrite
- Fluoride
- Iron and manganese
- Lead and copper
- Total coliforms and E. coli
- Disinfection byproducts such as trihalomethanes and haloacetic acids
- Total organic carbon and ultraviolet absorbance
- Special analytes such as arsenic, PFAS, cyanotoxins, or volatile organic compounds when warranted
Municipal Water Treatment Process Sampling Methods
Municipal water treatment process sampling methods are critical because a poor sample can produce misleading results even when the analytical method is excellent. Sampling plans are designed around representativeness, frequency, preservation, and chain of custody.
Common sampling approaches include:
- Grab samples, collected at a single point in time, often used for routine chemistry and microbiology.
- Composite samples, formed from multiple samples over time or flow, useful for characterizing variable conditions.
- First-draw samples, commonly used in lead and copper investigations to assess water that has stood in plumbing.
- Flushed samples, used to distinguish premise plumbing effects from mainline water quality.
- Automatic sampler collections, useful during storm events or process investigations.
Sampling protocols often specify bottle type, preservation chemical, holding time, dechlorination needs, transport temperature, and acceptable flow conditions at the tap. Microbiological samples require sterile containers and careful handling to prevent contamination. Metals samples may require acid preservation. Volatile organics need minimal headspace. These details are not administrative formalities; they directly affect data quality.
Field Testing and Online Monitoring
Many operational decisions rely on immediate measurements. Operators use portable or fixed instruments to monitor pH, turbidity, conductivity, chlorine residual, dissolved oxygen, and temperature in real time. Online analyzers provide continuous data streams, alarms, and trend information that support rapid response. For example, a sudden turbidity increase after filtration may signal breakthrough, while a residual disinfectant drop in the distribution system may indicate high demand, nitrification, or stagnation.
Field methods are fast and practical, but they require calibration, maintenance, and verification against reference methods. Sensor fouling, drift, reagent degradation, and improper calibration can undermine municipal water treatment process accuracy if not managed carefully.
Municipal Water Treatment Process Lab Analysis
Municipal water treatment process lab analysis provides the higher sensitivity, specificity, and defensibility needed for regulatory compliance and detailed investigation. Certified laboratories may use a range of techniques, including:
- Spectrophotometry for colorimetric chemical analysis such as chlorine, nitrate, or phosphate.
- Ion chromatography for anions such as nitrate, nitrite, sulfate, and fluoride.
- Inductively coupled plasma methods for metals such as lead, copper, arsenic, iron, and manganese.
- Gas chromatography or liquid chromatography for volatile and semi-volatile organic compounds, pesticides, and some emerging contaminants.
- Membrane filtration or presence-absence methods for microbiological indicators.
- Total organic carbon analyzers for organic loading and byproduct precursor assessment.
Laboratory analysis also includes quality control measures such as blanks, duplicates, matrix spikes, calibration checks, and control standards. These tools help determine whether a result reflects the sample or an analytical problem. Without quality control, numerical results can create false confidence.
Home Testing: Usefulness and Limits
Municipal water treatment process home testing has become more common as consumers seek immediate answers. Home strips and handheld kits can be useful for screening pH, hardness, chlorine, alkalinity, and in some cases nitrates or general metal presence. They may also help identify changes over time, especially in buildings with private treatment devices or noticeable plumbing issues.
However, home methods have significant limitations:
- They often have lower sensitivity than certified laboratory methods.
- They may be affected by user technique, lighting, timing, or interfering substances.
- They rarely provide the precision needed for compliance or health-based decision-making.
- They usually cannot assess complex contaminants such as volatile organics, disinfection byproducts, PFAS, or pathogen risks accurately.
Home screening is best treated as a first step. If a result suggests a possible problem, confirmation through a certified lab is the appropriate next move.
Understanding Municipal Water Treatment Process Test Results
Interpreting municipal water treatment process test results requires context. A single result may not mean much without trend data, sampling location, method detection limit, and comparison to regulatory standards or operational goals. For example, a chlorine residual that is acceptable at the treatment plant may be too low at the system edge. A lead result from a first-draw sample tells a different story than a flushed sample. A turbidity spike lasting five minutes may indicate something operationally significant even if the daily average appears acceptable.
Results should be evaluated in relation to:
- Regulatory maximum contaminant levels or treatment technique requirements
- Internal operational targets
- Historical trends and seasonal patterns
- Source water events such as storms, spills, or algal blooms
- Distribution conditions including water age, pressure changes, and pipe material
Accuracy, Precision, and Data Confidence
Municipal water treatment process accuracy depends on the entire chain of measurement, not just the instrument. Accurate data requires proper sampling, correct preservation, validated methods, trained personnel, calibrated equipment, and quality assurance oversight. Precision refers to consistency among repeated measurements, while accuracy refers to closeness to the true value. A method can be precise without being accurate if it is consistently biased.
Utilities strengthen confidence in data by using standard operating procedures, certified reference materials, inter-laboratory comparisons, duplicate analyses, and preventive maintenance schedules. Good data management is also essential. Results must be recorded, reviewed, and trended in a way that supports timely action.
Prevention and Treatment
Testing is valuable because it supports prevention. The best municipal systems do not wait for contamination to become obvious; they monitor conditions early and adjust treatment proactively. Prevention begins with source protection and continues through process control and distribution management.
Source Water Protection
Reducing contamination before it reaches the plant is often more effective and less costly than removing it later. Watershed management, land use controls, spill response planning, agricultural best practices, and source vulnerability assessments all reduce treatment burdens. Monitoring upstream conditions helps utilities anticipate changes before they affect finished water.
Treatment Optimization
Test data allows plants to optimize coagulation, sedimentation, filtration, adsorption, membrane processes, ion exchange, and disinfection. Jar testing can help determine coagulant dose. Turbidity and particle counts reveal filter performance. Organic carbon measurements help control disinfection byproduct precursors. Corrosion control relies on stable pH, alkalinity, and inhibitor dosing informed by chemistry testing.
Distribution System Management
Maintaining water quality after treatment requires residual disinfectant control, storage tank maintenance, main flushing, nitrification monitoring where chloramines are used, and corrosion control programs. Distribution testing can identify dead ends, long residence times, and areas with repeated low residual or microbiological concern. Utilities use this information to adjust operations and capital planning.
Public Communication and Response
Test findings also support public notification, advisories, and corrective action planning. When results indicate a meaningful risk, utilities must respond quickly with resampling, treatment adjustments, operational checks, and clear communication. Public trust improves when results are explained transparently and in understandable terms.
Readers interested in wider perspectives on water quality monitoring and treatment developments may explore global water quality topics and additional resources in water treatment systems.
Common Misconceptions
Misunderstandings about water testing are widespread. Correcting them is important because poor assumptions can lead to unnecessary alarm or, worse, false reassurance.
“Clear Water Is Safe Water”
Many contaminants are invisible. Pathogens, nitrates, dissolved metals, and numerous synthetic chemicals may be present without affecting color or clarity. Visual inspection is not a substitute for analytical testing.
“One Good Test Means the Water Is Always Fine”
Water quality changes over time. Seasonal conditions, operational adjustments, and distribution system effects can all alter results. Ongoing monitoring is necessary because one sample represents only a specific time and place.
“Home Kits Are as Reliable as Certified Lab Methods”
Home kits can be useful for screening, but they are not equivalent to regulated laboratory analysis. When health-based decisions are involved, certified methods remain the standard.
“If the Plant Meets Standards, Every Tap Must Match Exactly”
Premise plumbing, stagnation, and building-specific conditions can affect water between the main and the faucet. Compliance at the plant does not eliminate the need for targeted tap testing in certain situations.
“More Testing Automatically Means Better Safety”
Testing is only effective when it is well designed. Random, poorly preserved, or improperly interpreted samples do not improve protection. Good monitoring programs focus on the right parameters, locations, frequencies, and response actions.
Regulations and Standards
Municipal water testing programs are shaped by national and regional regulations, public health guidance, and standardized analytical methods. While specific rules vary by jurisdiction, the core principle is the same: water suppliers must monitor quality, document compliance, and take corrective action when standards are not met.
Regulatory Framework
Standards often include:
- Maximum contaminant levels for specific chemicals and microbial indicators
- Treatment technique requirements when direct measurement of a risk is less practical than controlling the process that manages it
- Monitoring frequency rules based on population served, source type, and prior compliance history
- Public notification requirements when violations or significant risks occur
- Operator certification and laboratory accreditation requirements
Method Standardization
Approved analytical methods are used so that results are comparable, reproducible, and legally defensible. Standard methods specify everything from sample preservation to instrument calibration, detection limits, and quality control acceptance criteria. This standardization is central to trustworthy municipal water treatment process lab analysis.
Reporting and Documentation
Utilities are generally required to maintain records of sampling locations, collection times, methods, calibration logs, laboratory reports, and corrective actions. Annual consumer confidence reporting in many regions helps communicate water quality data to the public. Documentation also supports audits, trend analysis, and emergency response planning.
Continuous Improvement
Regulations evolve as science advances. New contaminants may be added to monitoring programs, detection limits may improve, and treatment expectations may become more stringent. Utilities therefore need flexible testing programs that can adapt to new findings in toxicology, epidemiology, and analytical chemistry. Continued learning through professional practice and current research in water science supports that improvement.
Conclusion
Municipal water treatment process testing is the evidence-based backbone of safe drinking water delivery. It verifies whether treatment barriers are working, detects contamination before it spreads, guides operational adjustments, supports regulatory compliance, and helps utilities communicate clearly with the public. Effective programs combine source monitoring, process control, distribution sampling, field measurements, and certified laboratory analysis.
Understanding the differences among routine screening, municipal water treatment process sampling methods, municipal water treatment process home testing, and municipal water treatment process lab analysis is essential for interpreting water quality data correctly. Equally important is recognizing that municipal water treatment process accuracy depends on the full chain from collection to reporting. Reliable municipal water treatment process test results come from disciplined procedures, trained staff, validated methods, and a strong culture of quality assurance.
For anyone evaluating public water quality, the key lesson is simple: testing is not just a regulatory task. It is a continuous public health safeguard and a practical management tool. When done well, it allows municipal systems to move from reacting to problems toward preventing them, which is the foundation of resilient and trustworthy drinking water service.
Read the full guide: Water Treatment Systems Guide
Explore more in this category: Water Treatment Systems Articles